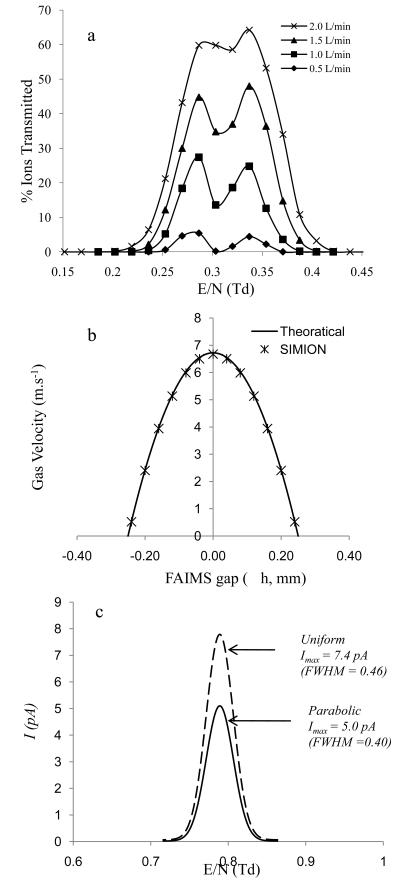
Figure 5.
a. Plot of CVE/N versus ion transmission for Leucine (0.29 Td, 3.2 V) and Hydroxyproline (0.34 Td, 4.0 V) at various gas flow rates ranging from 0.5 L.min−1 to 2.0 L.min−1; b. Comparison of theoretical (--) and SIMION (*) calculated parabolic flow profile that was derived from Navier-Stokes equation; c. a comparison of CV elution profile of hydrated proton with linear gas flow (--) and parabolic gas flow (—) that was applied across the FAIMS gap (±h).

