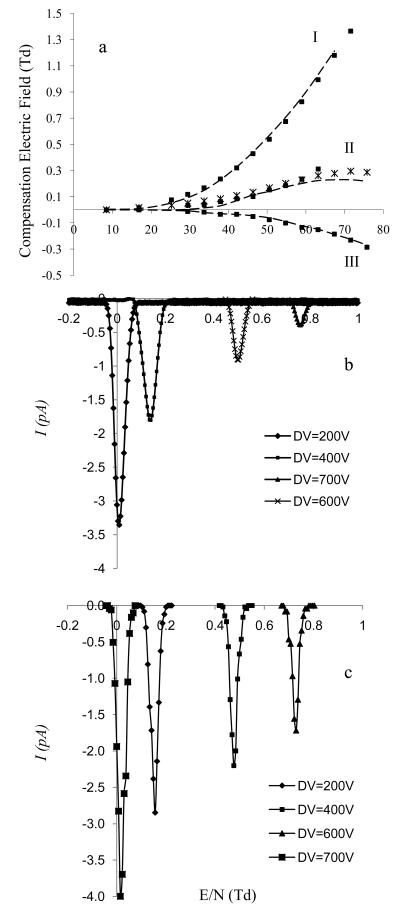
Figure 6.
a shows a comparison of experimental (broken line) and simulated (squares) dispersion plot (CVE/N versus DVE/N) of O2−(H2O)3 (I), (C3H6O)2H+ (II), and (C12H24O)2H+ (III). The DVE/N range translates to ~8Td to ~80 Td; b) shows a comparison of simulated and experimental plot of CVE/N versus ion transmission of O2−(H2O)3 at selected E/N: 16.85 Td (200V), 33.70 Td (400V), 50.55 Td (600V), and 59.0 Td (700V). CV was scanned from 0 V to 14 V, d = 0.3 and f = 0.83 MHz.

