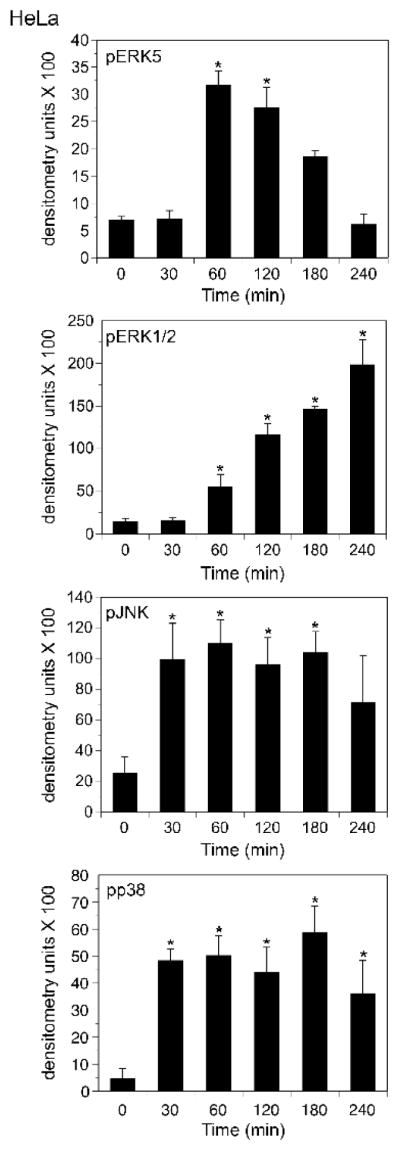
Figure 3. Palytoxin stimulates ERK5 with a different time course than ERK1/2, JNK, and p38 in HeLa cells.

HeLa cells were incubated with 30 pM palytoxin for the indicated times. Whole cell lysates (20 μg of protein) were analyzed by immunoblot for the following: ERK5; phosphorylated, active ERK1/2; phosphorylated, active JNK1 and JNK2; and phosphorylated, active p38. Each time point was run in triplicate. Band intensities were quantitated by densitometry for the graphical representation of the data. The units shown for pERK5 represent the ratio of the shifted ERK5 band to the total of the upper and lower bands as described in (Kato et al., 1998). The bars represent the average of triplicates +/− S.D. Asterisks denote values that were determined to be statistically significantly different from the zero time point (p < 0.01). The data shown are representative of at least three independent experiments.
