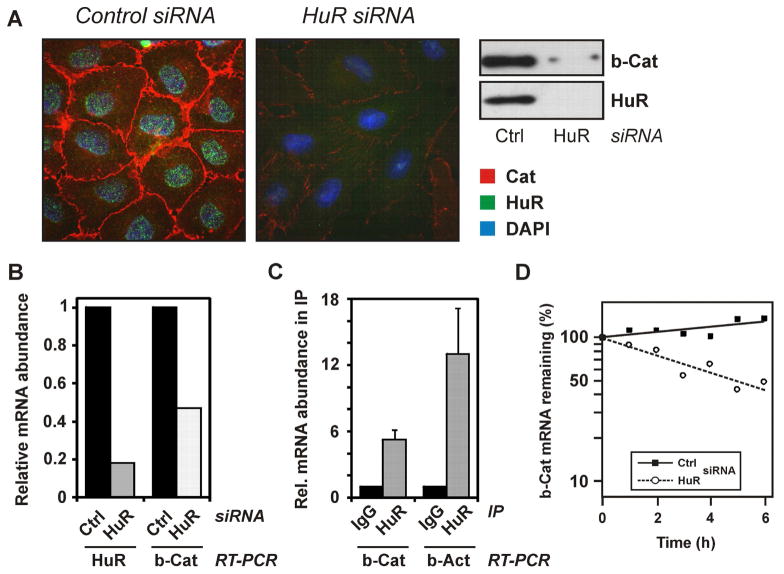
Figure 4.
Loss of β-catenin after HuR depletion and binding of HuR to β-catenin mRNA. (A) WB-F344 cells were treated with control or HuR-specific siRNA for 48 h, followed by immunocytochemical and Western analysis of subcellular localization and levels of β-catenin (red) and HuR (green). Nuclei were stained with DAPI (blue). Data are representative of three independent experiments. (B) Real-Time RT-PCR analysis of HuR and β-catenin mRNA levels in cells treated with control or HuR-specific siRNA. Data were normalized against 18S rRNA levels and control treatments were set to 1. Data are means of two independent experiments. (C) Binding of HuR to β-catenin mRNA. Immunoprecipitates from lysates of WB-F344 cells were prepared employing an anti-HuR antibody or control IgG. Coprecipitated mRNAs were identified by real-time RT-PCR. RNA levels were normalized against succinate dehydrogenase mRNA. As a positive control, levels of coprecipitated β-actin mRNA were analysed. (D) Cells were transfected and exposed to actinomycin D as described in the legend to Figure 2C, followed by Real-time quantitative RT-PCR analysis of β-catenin mRNA levels in cells treated with control or HuR-specific siRNA. Data were normalized to 18S rRNA levels and are means of two independent experiments.

