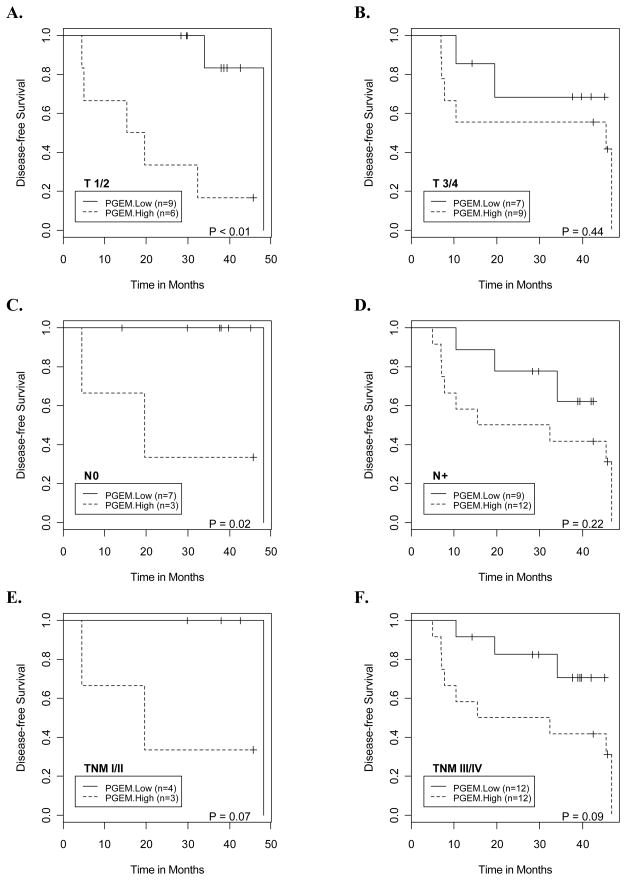
Fig. 3.
Kaplan Meier curves illustrate a consistent pattern of lower disease-free survival probabilities for patients with high baseline urinary PGE-M levels compared to those with low baseline urinary PGE-M levels at the following disease stage categories: A. T1/T2 primary tumors, B. T3/T4 primary tumors, C. N0 neck, D. N+ neck, E. Stage I/II and F. Stage III/IV.

