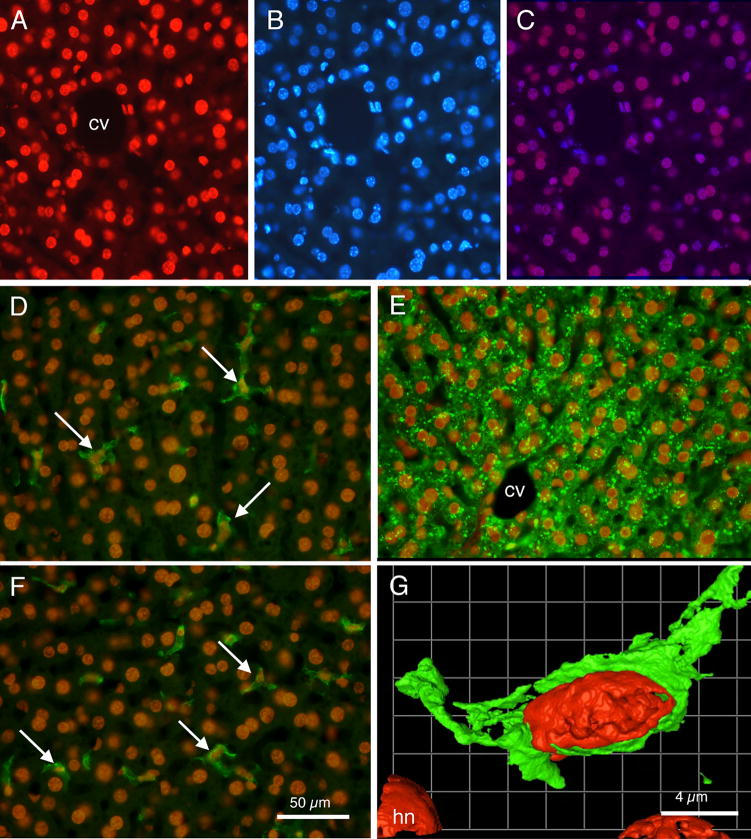
Fig. 8.
Fluorescence photomicrographs showing relationships of doxorubicin labeling and other cell labeling techniques in liver sections. (A) Rhodamine optics reveal doxorubicin labeled nuclei. Note varied shapes of labeled nuclei. (B) UV fluorescence optics reveal DAPI labeled cell nuclei in same section as shown in ‘A’. Note virtually all nuclei are labeled both by doxorubicin and by DAPI. (C) Merged images A and B; double labeled cell nuclei appear as purple. (D) Merged image showing doxorubicin labeled cell nuclei (orange) and F4-80 immunocytochemically labeled Kupffer cells in green (arrows). (E) Merged image showing doxorubicin labeled cell nuclei (orange) and hepatocytes immunocytochemically labeled for albumin (green). (F) Merged image showing doxorubicin labeled nuclei (orange) and GFAP labeled Ito stellate cells (arrows) in green. (G) Pseudocolored image from deconvolution software showing a doxorubicin labeled red nucleus within a F4-80 green labeled cell. cv: central vein; hn: hepatocyte nucleus. Calibration bar in F = 50 μm and is the same for panels A through F. Calibration bar in G = 4μm.

