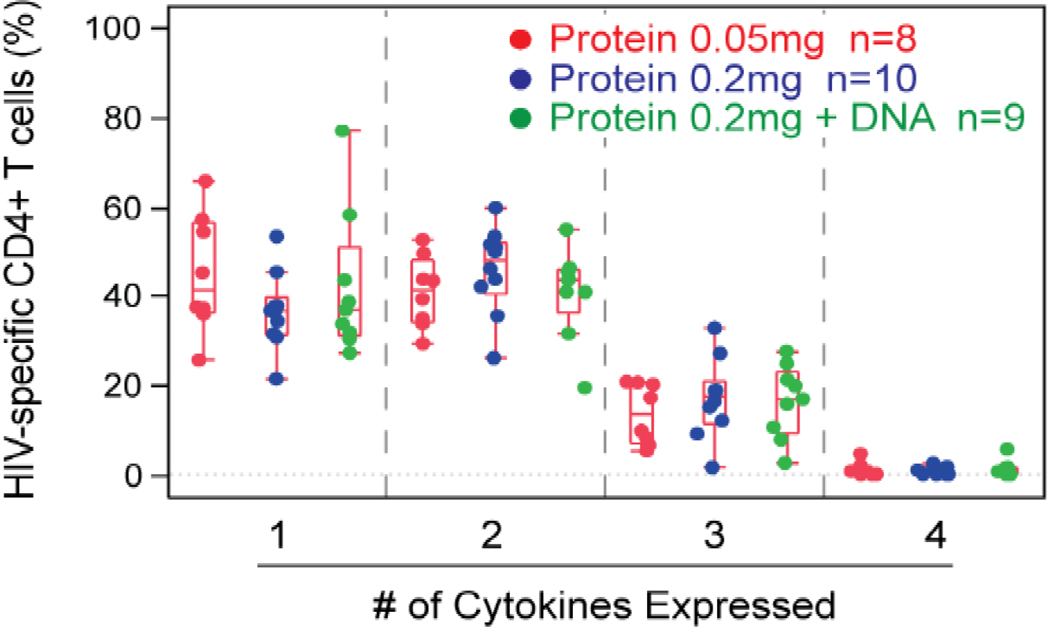
Figure 3. Cytokine-secreting CD4+ T cells are induced by EP-1043 vaccine.
Similar to that described in Figure 2, the poly-functional CD4+ T cells at 2 weeks post the 4th vaccination in trial participants were quantified by ICS assay. (a) For each participant with a positive response, the percentage of HIV-specific CD4+ T cells producing 1, 2, 3, or 4 cytokines is shown. Treatment group 1 is in red, group 5 in green, group 2 and 3 (blue) are combined since they both received 0.2mg of the EP-1043 vaccine. Group 4 is not shown because there no responses to the DNA vaccine. (b) The HIV-specific CD4+ T cells are further characterized by the specific cytokine or combination of cytokines produced. For each graph, the percentages plotted are relative to the HIV-specific CD4+ T cells producing 1, 2, or 3 cytokines.


