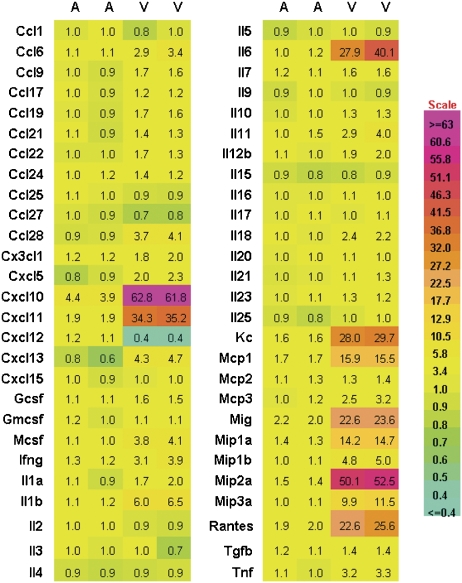
Fig. 4.
Cytokine/chemokine gene expression in infected kidneys. For each cytokine, the gene expression levels obtained by microarray analyses are shown relative to control, where A represents infection by the attenuated strain and V represents infection by the virulent strain. Expression level (-fold) change is colored as shown on the scale.

