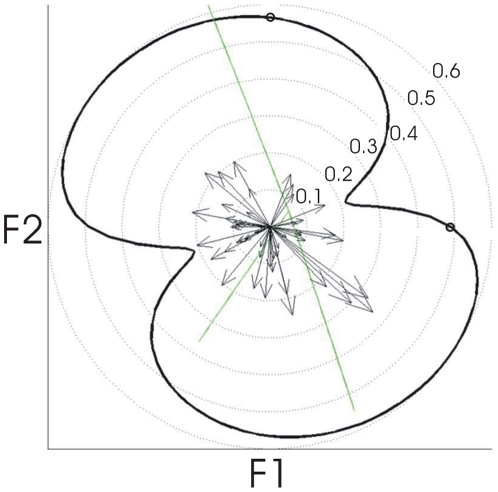
Figure 3. Formant tuning of individual units and of the neural ensemble.
Individual units: Black arrows represent the formant tuning of individual units in polar coordinates, with angle representing the preferred direction of movement and arrow length representing the tuning strength (see Methods for details). The strength of tuning to each possible direction of movement in formant space is computed as the average correlation (across sessions) between each unit's firing rate and the target formant position along this direction. The preferred direction of movement is then computed as the direction with maximal tuning strength among all possible directions. Neural ensemble: The black curve represents the formant tuning of the neural ensemble in polar coordinates, with angles representing each possible direction of movement and distance from origin representing the tuning strength. Green lines represent the directions of movement in formant space of the three target sounds used for training, and the two small circles along the neural ensemble tuning curve represent the average strength of the correlations between firing rates and F1 (r = 0.49, p<.001), and F2 (r = .57, p<.001), respectively.

