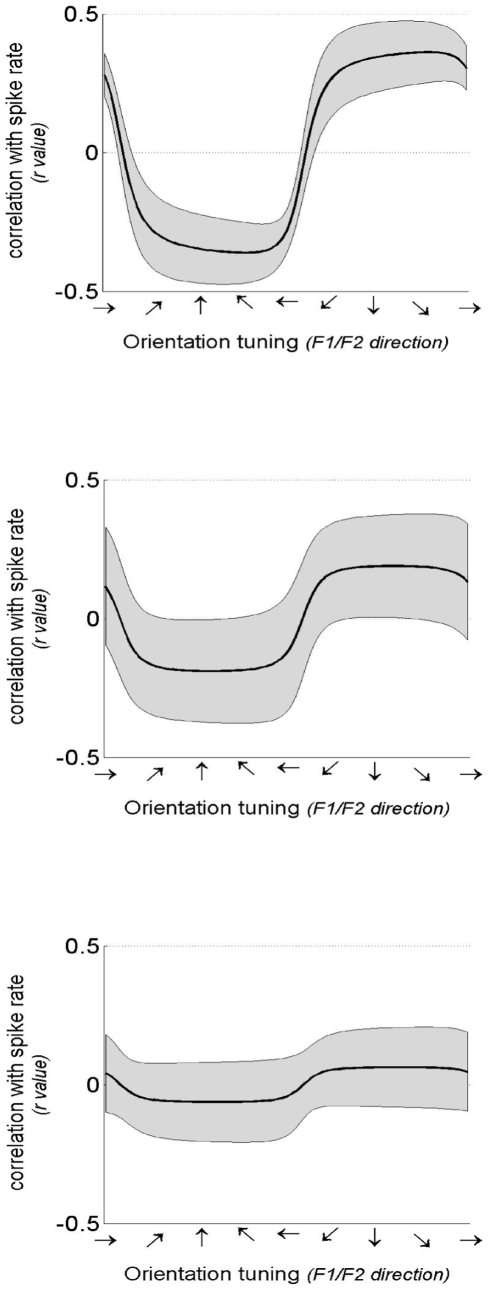
Figure 5. Sample tuning curves for representative good (top), average (middle), and poor (bottom) tuned units.
Tuning curves (black) and 95% confidence intervals (gray) are computed as described in Methods : Formant tuning analyses. Tuning strength is indicated by the correlation between unit firing rates and formant frequency. The three units shown are primarily tuned to changes in F2, illustrated by relatively low values at each horizontal direction.

