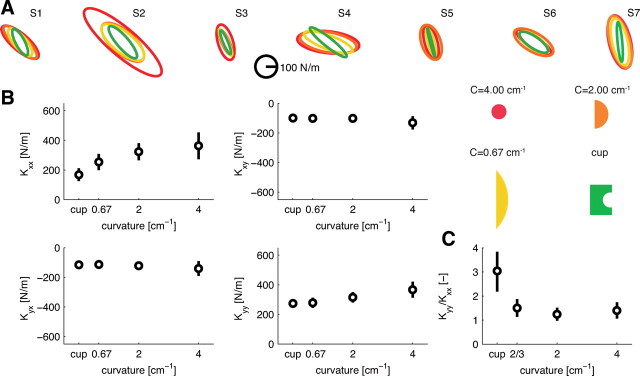
Figure 5.
Endpoint stiffness is adapted to the curvature of the objects for forces in the second study (positive y-direction). A, Endpoint stiffness represented as an ellipse for all subjects (S1–S7) and object curvatures (color codes shown). B, The mean ± SEM elements of the endpoint stiffness matrix. Only Kxx shows a significant increase with object curvature. C, Changes in the ratio of Kyy and Kxx of the stiffness matrix.

