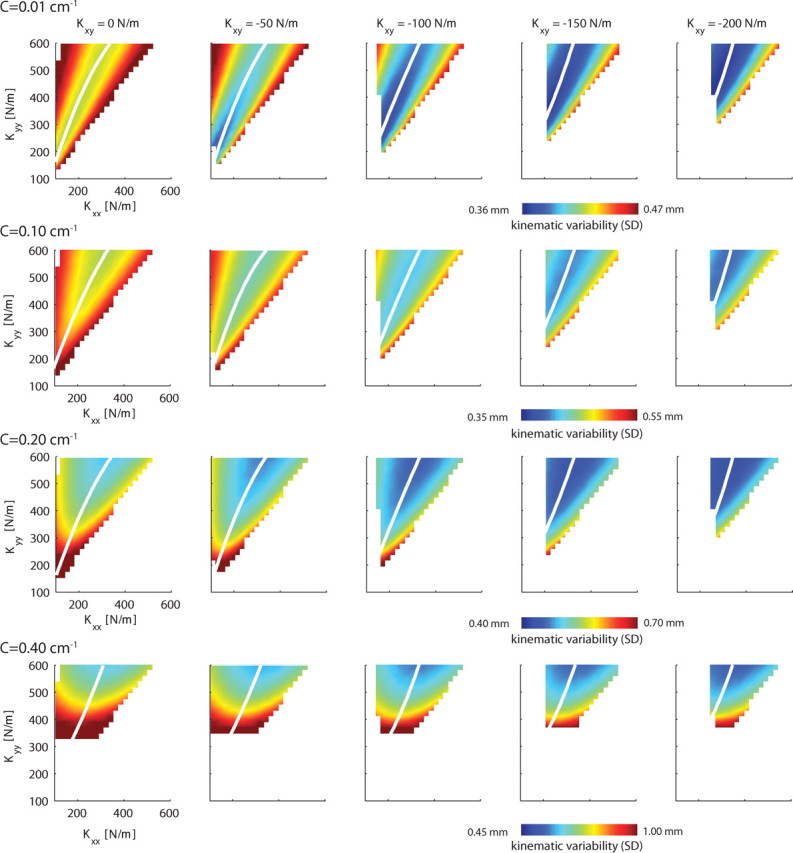
Figure 7.

The simulated variability of endpoint position in relation to the endpoint stiffness and task geometry for the main study. Endpoint variability is caused by SDN on the muscular forces. Each panel depicts the kinematic variability (SD) as a function of Kxx and Kyy. The columns represent different off-diagonal terms of the stiffness matrix (Kxy), with the leftmost column showing all stiffness geometries having one of their axes along the instability direction. Task geometry is expressed as object curvature, which increases down the rows [C = (0, 0.1, 0.2, 0.4) cm−1]. The kinematic variability results for each object curvature are plotted using different scales as indicated beneath each row. Note that, with increasing curvature, the kinematic variability increases, which for some stiffness geometries results in slip offs. This is reflected by the increase of the white area. White lines indicate the valley of kinematic variability minima (i.e., the Kxx that minimizes the kinematic variability for a given Kyy).
