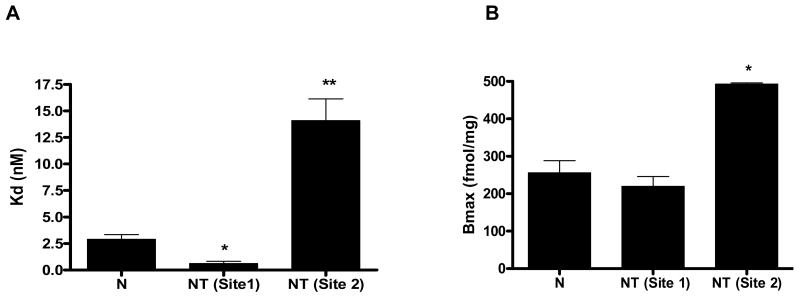
Figure 5.
A: A quantitative summary of the kinetic profiles characterizing binding affinity in naïve (N) and theophylline-treated (NT) animals. In the histogram, the Kd value in the naïve group was 2.89 ± 0.45 (nM) and the theophylline-treated group was 0.60 ± 0.21 (nM). The Kd value for the second site was 14.09 ± 2.06nmol/L. The histogram was generated from saturation binding studies. Displacement of 1nM [3H]-DPCPX binding, to rat spinal cord (C3-C5) homogenate from naïve rats and theophylline treated rats by 2.7pM-27mM theophylline. Values represent the mean specific binding as a percentage increase above basal binding (± SEM) of at least three experiments each performed in triplicate. All values are corrected for non specific binding (NSB) defined with 100μM adenosine. B: Histogram showing the respective Bmax values in naïve and theophylline-treated animals. Bmax for the naïve amounted to 256.00 ± 32.13 (fmol/mg protein) and the theophylline-treated was 219.00 ± 26.3 for site 1 which appears to be the same in both groups. More importantly however, a second binding site with a Bmax of 492.6 ± 3.15 (fmol/mg protein) is unmasked and persisted when drug was weaned for 12 days. (Reprinted from Saharan and Nantwi, 2006).

