
Fig. 2.
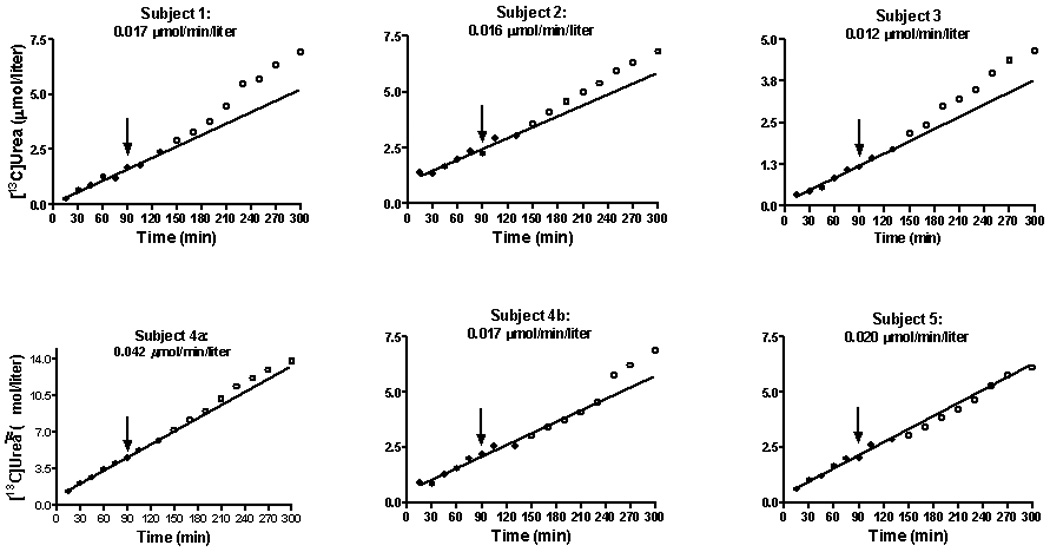
The concentration of [13C]urea in plasma during the constant infusion of NaH13CO3 (Fig. 1) in healthy adults. The line represents linear regression analysis from 10 to 150 minutes. At 90 minutes each subject received an oral dose (50 mg/kg) of NCG. The closed circles correspond to the period during which the linear regression was performed. The open circles are points from 150 until 300 minutes and correspond to the post-treatment values. The time from 10 until 150 minutes is included in the regression because this is a period of drug absorption. The number at the top of each graph(µmol/min/liter) correspond to the rate of [13C]urea appearance in blood. Calculation was done as explained above (Methods).