
Fig. 3.
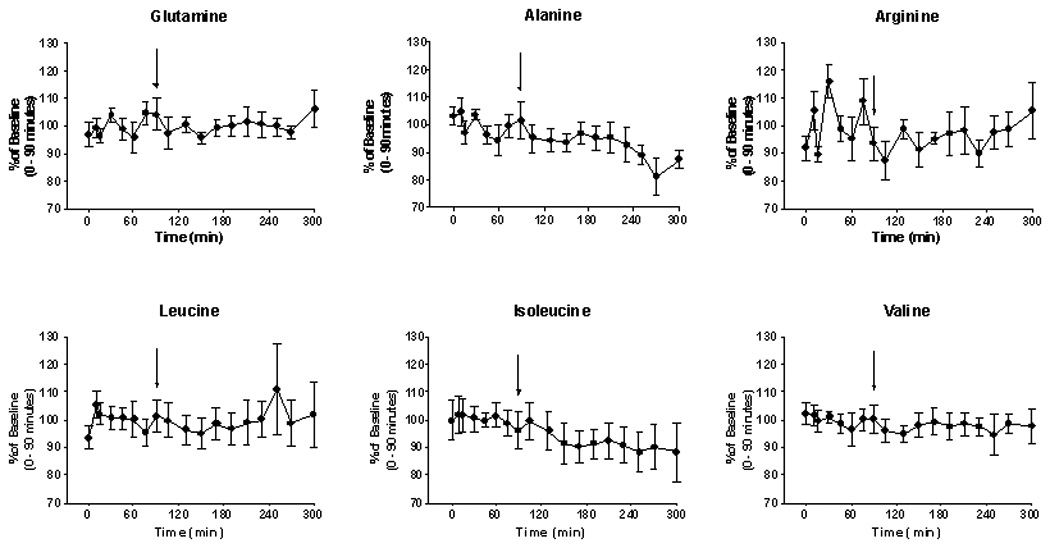
Plasma amino acid levels (mean ± SEM) for the 6 studies in healthy volunteers. The data are expressed as a percentage of the baseline T0) value in order to facilitate comparison. The arrow denotes an oral dose (50 mg/kg) of NCG, taken in an aqueous solution. As noted (Results), significant (p < .05) changes in concentration post-NCG were observed with regard to the concentration of alanine and of isoleucine.