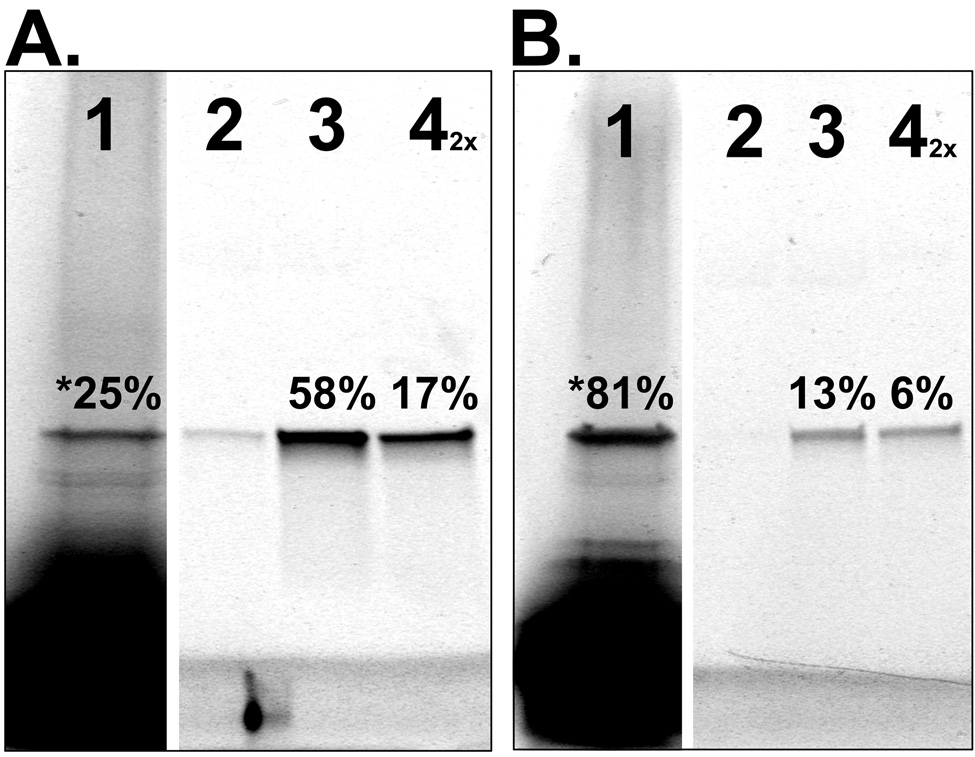
Figure 4. Demonstration and Analysis of PC-SNAG by fluorescence SDS-PAGE.
Human GST was cell-free produced using a coupled transcription/translation rabbit reticulocyte lysate. (A.) GST was TRAMPE labeled only with BODIPY-FL and PC-SNAG was achieved using a PC-antibody against a C-terminal HSV epitope tag. (B.) GST was TRAMPE labeled using PC-biotin and BODIPY-FL misaminoacylated tRNAs together and PC-SNAG was achieved based on the directly incorporated PC-biotins. All fractions from the PC-SNAG process were collected and separated by SDS-PAGE followed by fluorescence imaging of the incorporated BODIPY-FL labels. Wash fractions were collected and quantified but are not shown. Distribution of GST across the various fractions is expressed as a percent of the total GST. Lanes: 1 = Initial unbound fraction. The asterisk denotes that the number represents the total unbound GST, calculated by summing the initial unbound (shown) and wash fractions (not shown); 2 = Minus light elution (negative control); 3 = Plus light elution; 4 = Remaining bound to beads eluted by denaturation (the 2X indicates this fraction was loaded on the gel at twice the amount relative to other fractions).

