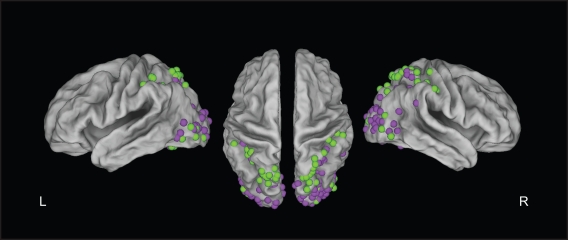
Figure 1.
Summary figure of PET and fMRI studies testing monocular (green dots) or binocular (purple dots) stimuli. This figure was constructed by plotting peak activations in CARET software from studies of distance perception that (a) reported peak activations in dorsal stream regions; and (b) reported the results of whole-brain (not ROI-based) analyses. This resulted in 18 studies (Gulyas and Roland, 1994; Mendola et al., 1999; Nishida et al., 2001; Shikata et al., 2001; Gilaie-Dotan et al., 2002; Iwami et al., 2002; Negawa et al., 2002; Acosta-Mesa et al., 2004; Richter et al., 2004; Rutschmann and Greenlee, 2004; Brouwer et al., 2005; Naganuma et al., 2005; Tyler et al., 2005; Hayashi et al., 2007; Quinlan and Culham, 2007; Georgieva et al., 2008; Hegdé et al., 2008).

