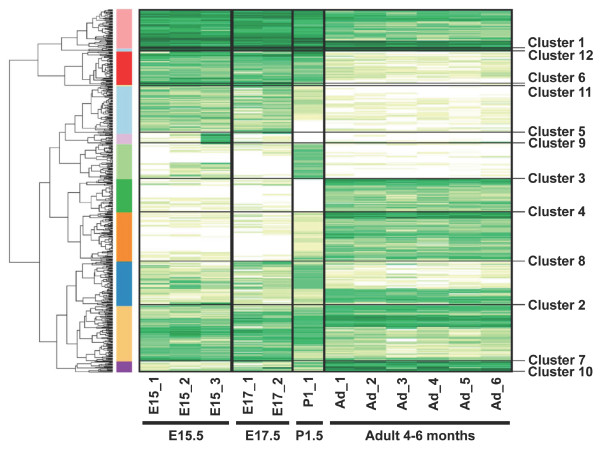
Figure 1.
Hierarchical clustering of 561 differentially expressed transcripts/tags. Log2 of normalized counts of DETs from cerebral cortices of various developmental stages were clustered. Dark green clusters denote high levels of expression whereas light green to white clusters denote low levels of expression. The x-axis represents the SAGE libraries whereas the y-axis represents the SAGE tags. The panel on the right shows the 12 different clusters.

