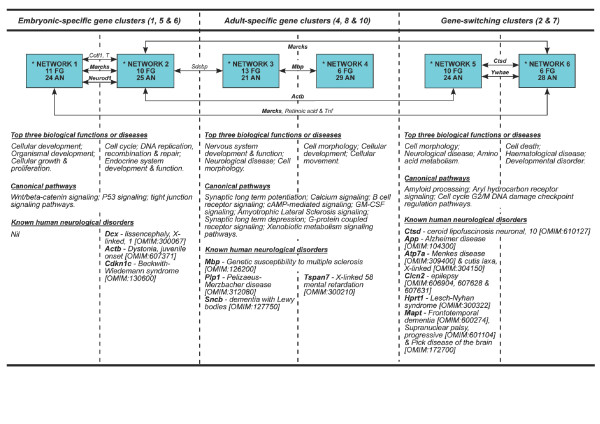
Figure 3.
Novel molecular networks involved in cerebral corticogenesis. The figure shows novel molecular networks, related biological functions/diseases, canonical pathways and known human neurological disorders based on Ingenuity Pathway Analysis and OMIM database. Detailed molecular interactions for all networks (indicated by asterisks) are illustrated in Figures S4, S5, S6, S7, S8 and S9 in Additional data file 1. Gene names next to arrow lines refer to common genes shared by two networks. Bold gene name refers to a focus gene. AN: associated nodes; FG: focused genes.

