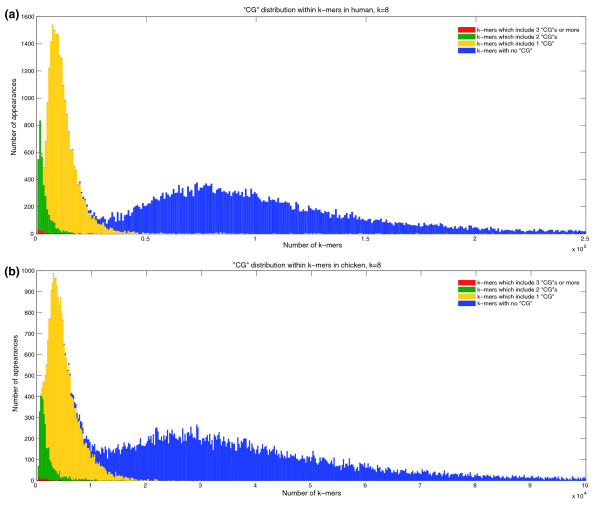
Figure 4.
k-mer spectra of human and chicken, partitioned according to number of CpG dinucleotides in k-mers. k-mers with multiple CpGs are dominant among rare k-mers in the spectra of (a) human, and (b) chicken (k = 11). The 11-mer spectra are color-coded: blue, 11-mers with no CpG dinucleotides; yellow, exactly one CpG; green, exactly two CpG instances; red, three CpG instances or more.

