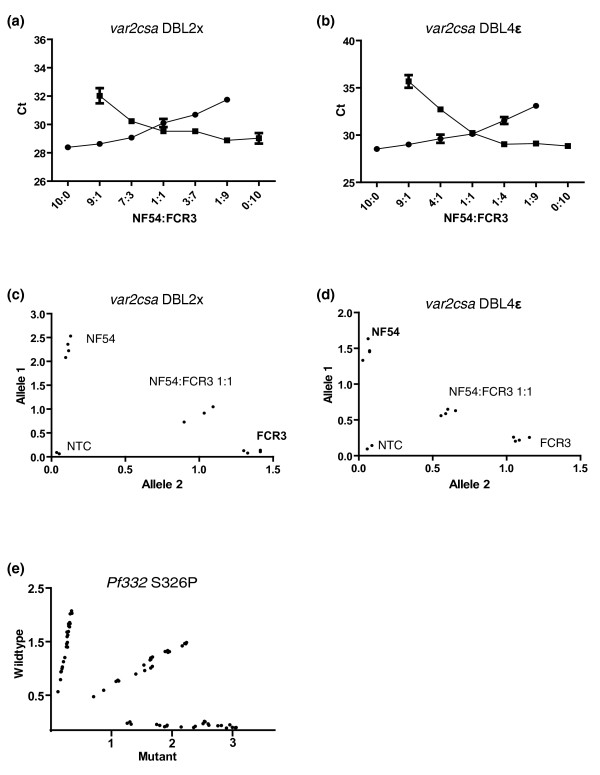
Figure 2.
Quality and performance assessment of allelic discrimination assays. (a, b) Shown are cycle thresholds (Ct) achieved using different ratios of NF54 and FCR3 gDNA and discriminative assays for var2csa DBL2x (a) and DBL4ε (b). Filled squares represent amplification of allele 1 (detected with FAM) and filled circles indicate amplification of allele 2 (detected with VIC), with error bars representing standard deviations. (c, d) Total fluorescence emission, with background deducted, for mixes of NF54 and FCR3 gDNA using the same assays also demonstrates the specificity of var2csa probes. (e) Pf332 allele specificity and concentration dependency is shown using serial dilutions of HB3 gDNA. Amplifications in the presence of only wild-type probe (y-axis), mutant probe (x-axis) or a combination of both (middle) are shown. No template controls (NTC) consistently showed negligible signals in all experiments.

