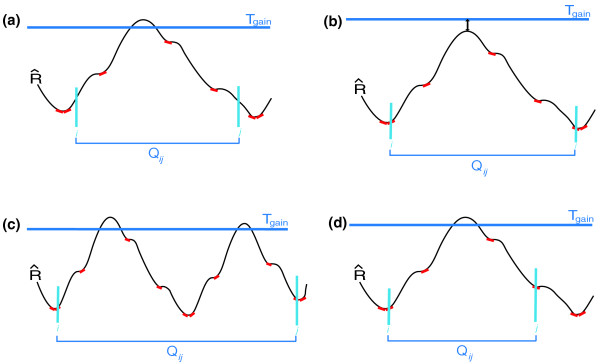
Figure 9.
Illustration of criteria for selection of candidate CNV regions. In this figure, the red lines tangent to the signal curve indicate the marker points that are elements of the sets Dmax and Dmin. (a) Qij violates the first condition, which requires that the start and end markers be elements of Dmax and Dmin, respectively. (b) Qij violates the second condition, which dictates that at least one marker must exceed the Tgain threshold value. (c) Qij does not satisfy the third condition since three markers of Dmin appear before two markers of Dmax in region Qij. (d) Qij violates the fourth condition, which requires that Qij is a maximal set satisfying all the first three conditions.

