Figure 1.

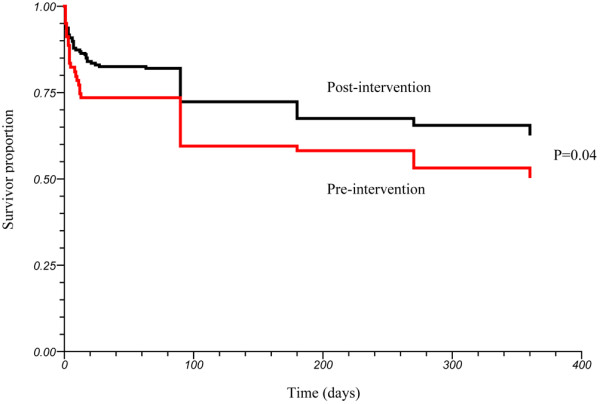
Kaplan Meier survival curve comparing survival of patients in the pre-implementation and post-implementation phases. The P value shown was derived from the log-rank test.

Kaplan Meier survival curve comparing survival of patients in the pre-implementation and post-implementation phases. The P value shown was derived from the log-rank test.