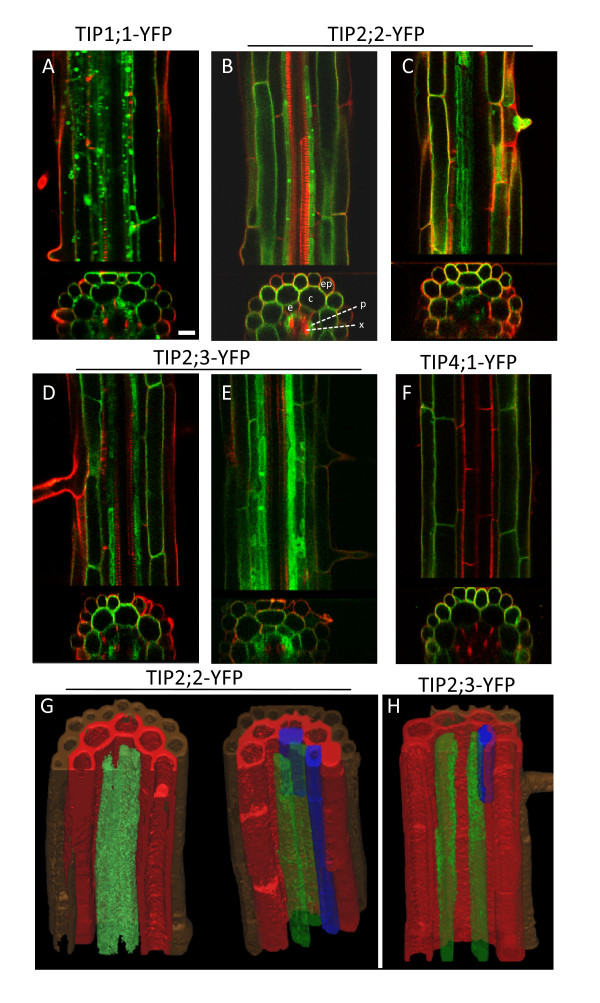
Figure 2.
Cell-type specificity of TIP-YFP expression in the root axis. 8-day old roots from the indicated transgenic lines were excised, stained with propidium iodide for 2 min and visualised by CLSM. Stacks of 80 optical z sections (1 μm step-size) were collected from root axes at the differentiation zone. The images show representative results for each construct. A to F: for each panel, the top section shows a single xy optical section, and the bottom section shows the xz projection of the whole image stack, revealing the cross section of the root axis. The signals from YFP fluorescence (green) and propidium iodide fluorescence (red) are merged. G and H: the YFP fluorescence trace from representative image stacks for the indicated transgenic lines was reconstructed, segmented and rendered in 3D with Mimics 12.1. The different tissues are colour-coded as follows: brown, epidermis; red, cortex; blue, endodermis; green, pericycle. Ep, epidermis; c, cortex; e, endodermis; p, pericycle; x, xylem. Scale bar: 20 μm.

