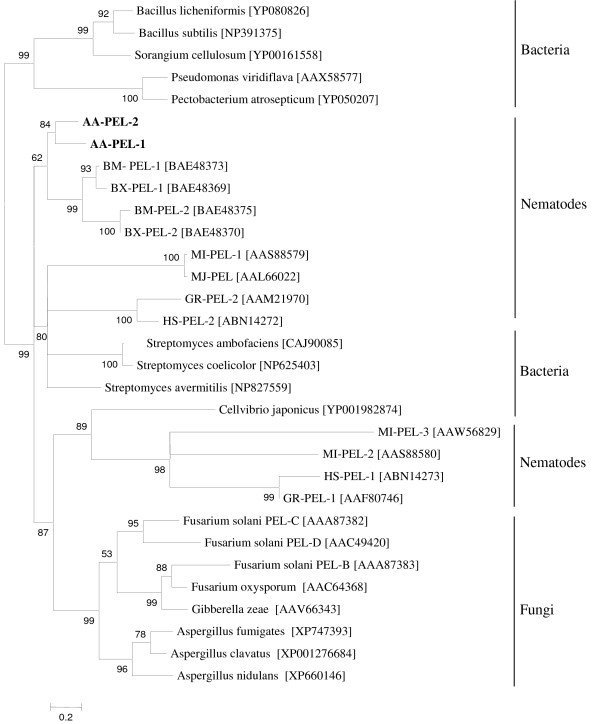
Figure 8.
Unrooted phylogenetic tree of selected polysaccharide lyase family 3 proteins generated using maximum likelihood analysis. The PL3 proteins from A. avenae (AA-PEL-1 and AA-PEL-2) are labeled in bold. GenBank accession numbers of PL3 proteins from Bursaphelenchus mucronatus (BM-PEL-1 and BM-PEL-2), Bursaphelenchus xylophilus (BX-PEL-1 and BX-PEL-2), Meloidogyne incognita (MI-PEL-1, MI-PEL-2 and MI-PEL-3), Meloidogyne javanica (MJ-PEL), Globodera rostochiensis (GR-PEL-1 and GR-PEL-2), Heterodera schachtii (HS-PEL-1 and HS-PEL-2), bacteria and fungi are indicated in brackets. The bootstrap values are calculated from 1000 replicates. The scale bar represents 20 substitutions per 100 amino acid positions.

