
Figure 3.
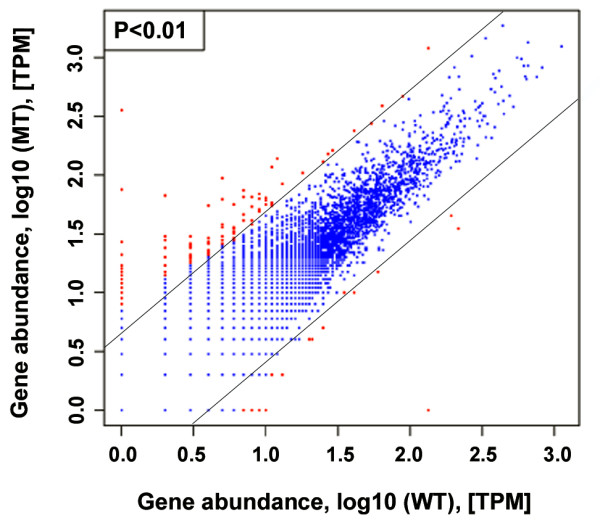
Comparison of unigenes expression between the mutant and the wild type. The abundance of each gene was normalized as transcripts per million (TPM). Up- or down-regulated genes, as defined at 0.01% significance level, are shown in red, and genes not differentially expressed between the mutant and the wild type are shown in blue.