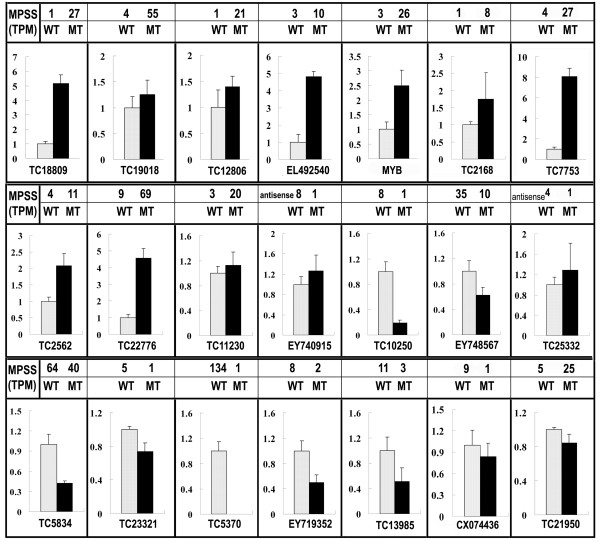
Figure 5.
Real-time quantitative RT-PCR confirmation of the differentially expressed genes between the wild type (grey columns) and the mutant (black columns). Columns and bars represent the means and standard error (n = 3) respectively. The transcript abundance from MPSS data was added on the top of each gene. TPM, transcripts per million.

