
Figure 6.
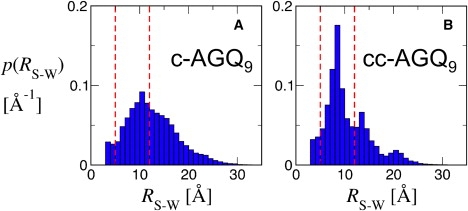
Distribution of end-to-end distances calculated from trajectories of c-AGQ9 (A) and cc-AGQ9 (B). Red lines indicate boundaries between “contact”, “kinked”, and “open” subsets (as in Fig. 5).
Official websites use .gov
A
.gov website belongs to an official
government organization in the United States.
Secure .gov websites use HTTPS
A lock (
) or https:// means you've safely
connected to the .gov website. Share sensitive
information only on official, secure websites.
Distribution of end-to-end distances calculated from trajectories of c-AGQ9 (A) and cc-AGQ9 (B). Red lines indicate boundaries between “contact”, “kinked”, and “open” subsets (as in Fig. 5).