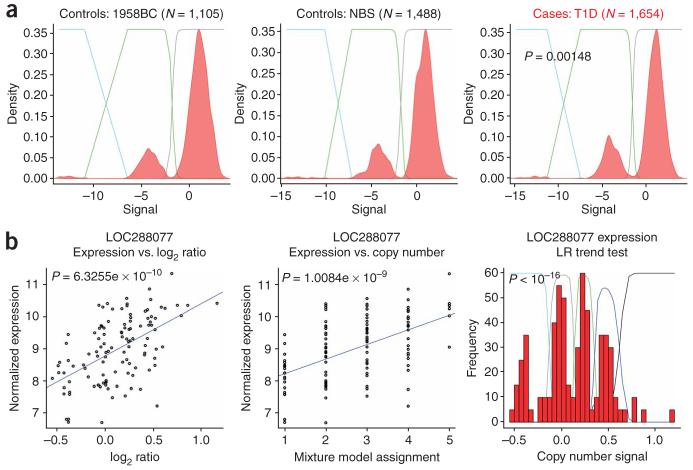
Figure 6.
Examples of empirical CNV associations. (a) Association with a binary disease trait, type 1 diabetes (T1D). The red shaded area represents a density plot of copy number measurement in each group. The two WTCCC control groups come from the 1958 Birth Group (1958BC) and the National Blood Service (NBS). The colored lines reflect the posterior probability distribution for each mixture in the fitted mixture model. The P value derives from the LR trend test comparing case and control groups. (b) The first panel shows normalized expression of gene LOC288077 against copy number measurement, with a linear regression shown in blue. The second panel shows normalized gene expression against mixture model assignment, with a linear regression shown in blue. The P values in these two plots represent the nominal P values on the regression. The third panel shows a histogram of copy number measurement and the colored lines represent the posterior probability distribution for each of the five copy number classes in the fitted mixture model used in the LR trend test.

