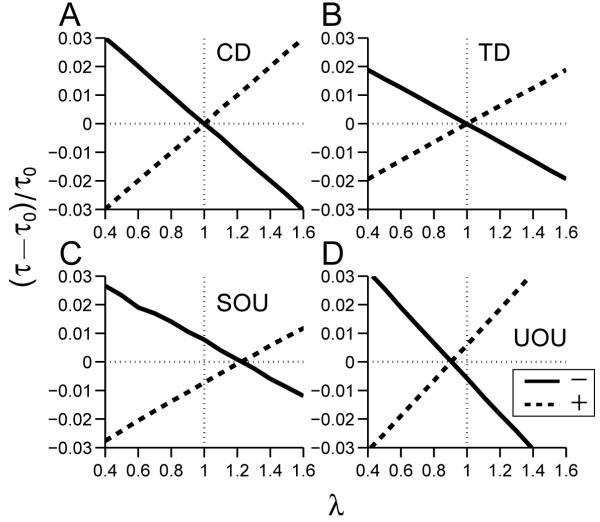
Figure 4.
Zero-effect perturbations of linear integrate-to-threshold models CD, TD, SOU, UOU (panels A-D). Vertical axes: normalized change in mean first passage times (τ - τ0)/τ0; horizontal axes: relative amplitude of first pulse compared to second. Zeroes of solid lines (-, positive pulse followed by negative pulse, p < 0) and dashed lines (+, negative pulse followed by positive pulse, p > 0) identify ZEPs at λ* ≈ 0.9987, 1.0039 (CD); 0.9952, 1.0004 (TD); 1.2271, 1.2230 (SOU) and 0.9066, 0.9034 (UOU).

