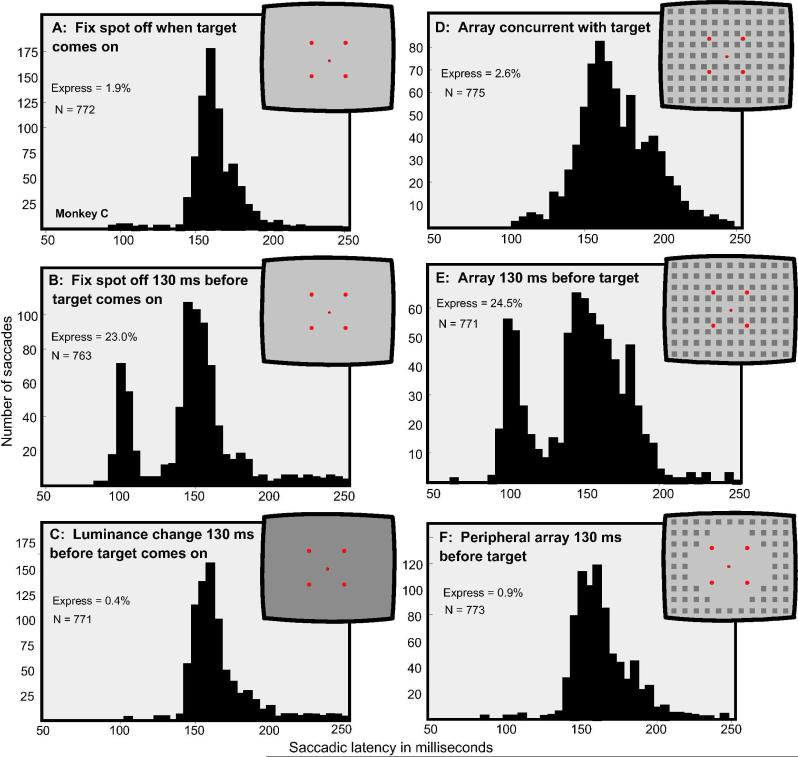
Figure 2.
The distribution of saccadic latencies to single visual targets appearing in one of four locations 3.3 degrees from central fixation under six conditions of presentation. The insets depict the experimental conditions. A: The target appeared upon termination of the fixation spot. B: The target appeared 130 ms after termination of the fixation spot. C: The overall illumination of the background was changed from 10.8 to 23 cd/m2 130 ms prior to the appearance of the target. D: The array, as shown in the inset, appeared concurrent with the target and the termination of the fixation spot. E: The array appeared 130 ms prior to the target. F: An array consisting only of elements peripheral to the target location, as shown in the inset, appeared 130 ms prior to the target. Conditions B and E produced numerous express saccades, the other conditions did not.

