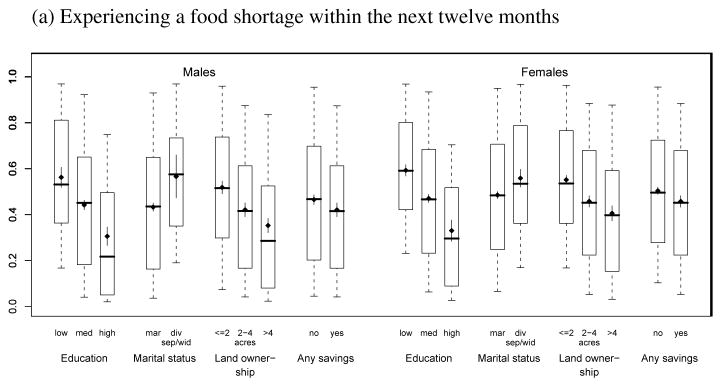
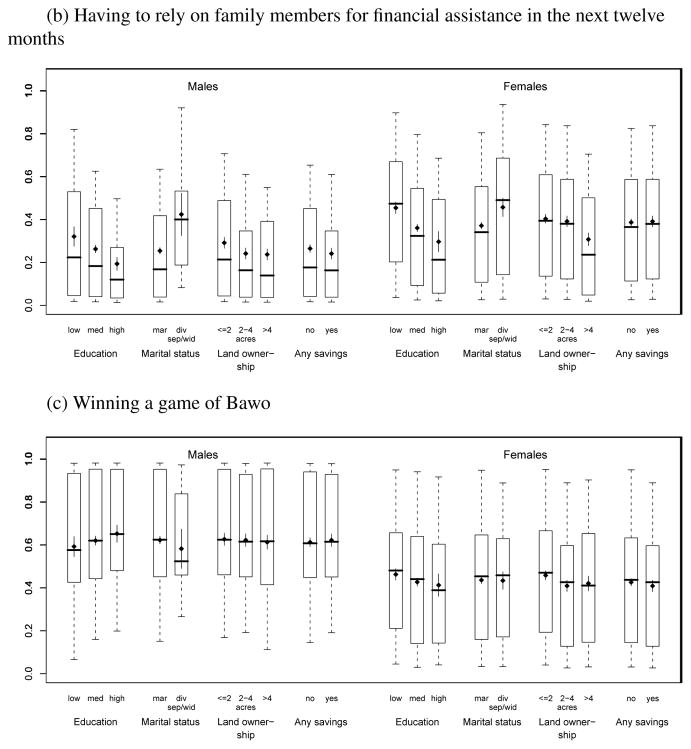
Figure 3.
Distribution of ever-married respondents’ subjective probability of (a) experiencing a food shortage within the next twelve months, and (b) having to rely on family members for financial assistance in the next twelve months, and (c) winning a game of Bawo played against the interviewer, by gender and socioeconomic status
Notes: Ever-married respondents only; region is coded as: N = North (Rumphi), C = Center (Mchinji), S = South (Balaka)


