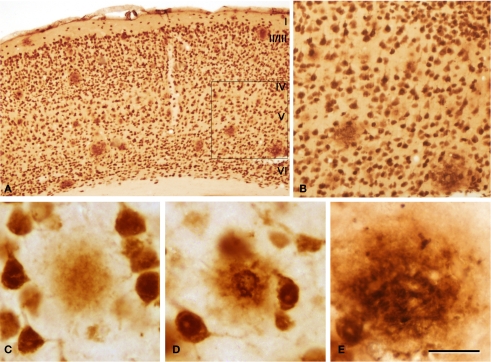
Figure 4.
(A) Low-power photomicrograph from a section double stained for anti-Aβ and NeuN, showing the pattern of immunostaining in layers I–VI of the neocortex of an APP/PS1 transgenic mouse. (B) Higher magnification of the boxed area in (A). (C–E) Examples of diffuse, cored neuritic and non-cored neuritic plaques, respectively. Scale bar, 200 μm in (A); 100 μm in (B); 50 μm in (C–E).

