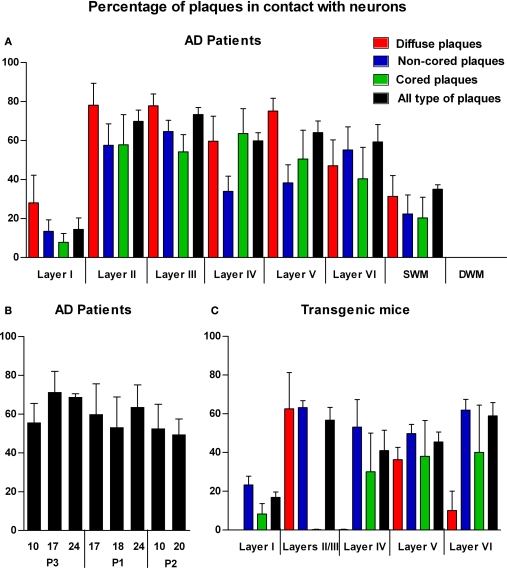
Figure 5.
(A) Bar diagram illustrating the percentage of the different types of plaques (diffuse, non-cored neuritic, and cored neuritic) in contact with neurons by cortical layers in the neocortex of AD patients. (B) Bar diagram illustrating the percentage of plaques (all types) in contact with neurons in different cortical areas (areas 10, 17, 24 and 20) of patients P1, P2 and P3. (C) Bar diagram illustrating the percentage of the different types of plaques in contact with neurons by cortical layers in the neocortex of transgenic mice (see Tables 3 and 4 for statistical comparisons).

