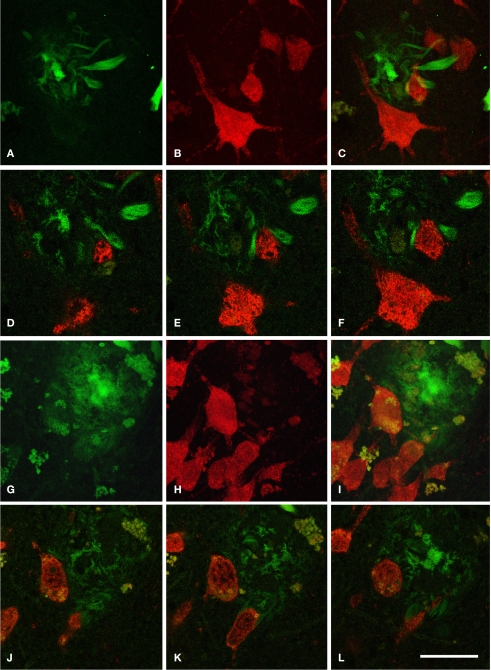
Figure 6.
Series of confocal images from patient P2 of two plaques (A–F) and (G–L) in contact with neurons doubled labeled for NeuN (red) and Thioflavine-S (green). (A–C) Represent stacks of 11 optical sections separated by 1 μm in the z-axis (total 9 μm). (D–F) Single optical sections of the plaque shown in (A–C) at different levels (6, 8, and 10 steps, respectively). (G–I) Represent stacks of 43 optical images separated by 0.50 μm in the z-axis (total 21 μm). (J–L) Single optical sections at different levels (10, 14, and 21 steps, respectively) of the plaque shown in (G–I). Scale bar, 25 μm in (A–L).

