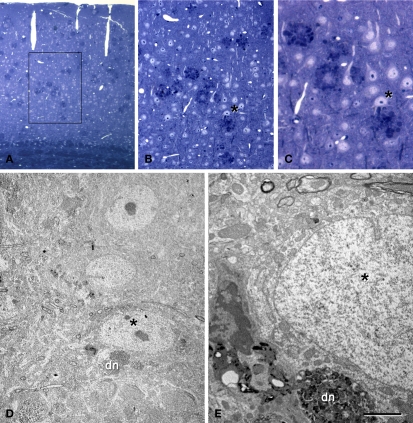
Figure 8.
Correlative light and electron microscopy photomicrographs of plaques from the neocortex of an APP/PS1 transgenic mouse. (A–C) Photomicrographs of a 2-μm thick semithin plastic section stained with 1% toluidine blue showing plaques in the neocortex of an APP/PS1 transgenic mouse. (B,C) are successive higher magnifications of the boxed area in (A). (D) Low-power electron micrographs taken after resection of the semithin section shown in (C), illustrating a neuron (asterisk) in contact with a plaque (dn, indicates a dystrophic neurite). The same neuron is indicated in (B,C). (E) Higher magnification of (D) to illustrate the neuron in contact (asterisk) with the dystrophic neurite (dn). Scale bar, 150 μm in (A); 50 μm in (B); 12 μm in (C); 10 μm in (D); 2 μm and (E).

