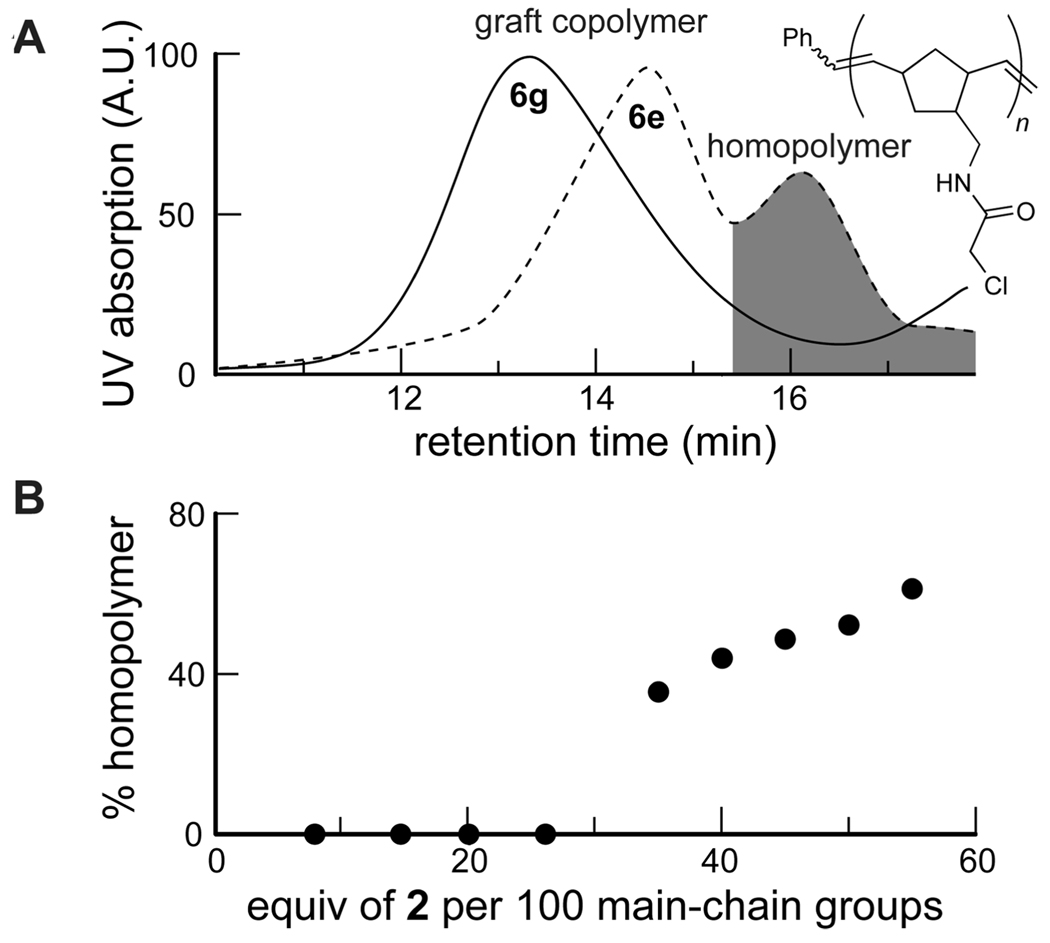
Figure 2.
Control of side-chain density in graft copolymers. (A) SEC–UV (λ = 254 nm) traces of 6e and 6g showing presence or absence of a shoulder (gray area) with a retention time greater than that of the graft copolymer. The shoulder is likely due to the depicted homopolymer. (B) Graph of the ratio of homopolymer to total polymer as a function of catalyst equivalents, determined by measuring the area of the SEC traces of 6a–i.

