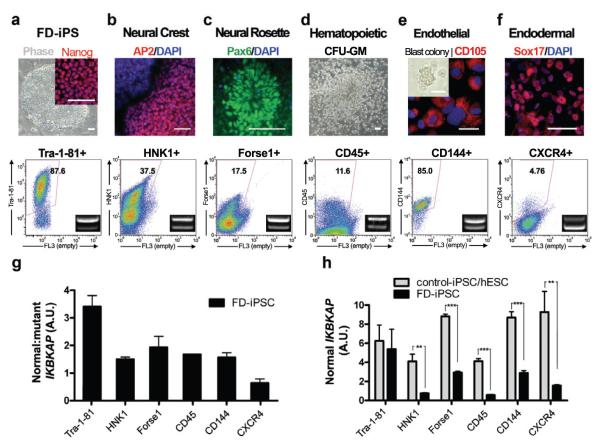
Figure 2. FD-iPSC derived cell lineages model the tissue specificity of FD IKBKAP splicing defect.
a, Undifferentiated iPSCs were defined by NANOG expression and quantitative analysis of TRA1-81. b-f, FD-iPSCs were directed towards specific lineages and purified by flow-cytometric sorting for appropriate surface markers. The cell types analyzed included AP2+ neural crest precursors purified based on HNK1+ expression (b), FACS purified Forse1+ neural rosette cells (Pax6+) (c), hematopoietic cells that were harvested from colony forming unit culture and sorted with CD45 marker (d), FACS isolated CD144+ (VE-cadherin) endothelial cells (CD105+) from blast colony culture (e), FACS isolated CXCR4+ endodermal precursors (Sox17+) from ActivinA-induced differentiation culture (f). IKBKAP RT-PCR products of FACS purified lineages (bottom panel). The ratio of normal:mutant splicing (g) and expression of normal IKBKAP transcript (h) are shown. n = 3 – 6; **, P < 0.01; ***, P < 0.001. All values are mean ± s.d. All scale bars correspond to 50μm.

