Figure 1.

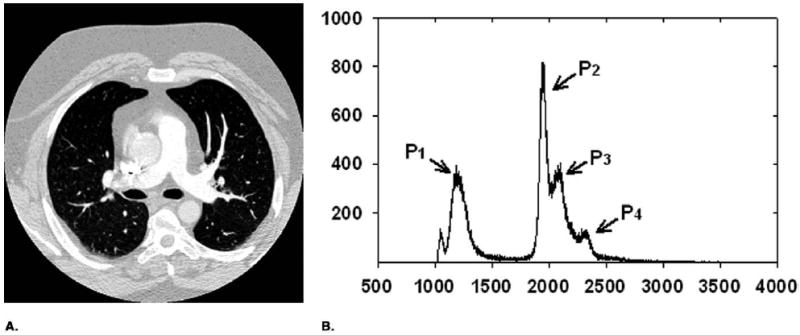
(a) Typical CT slice image after DC component shifting. (b) Histogram of thoracic region excluding zero gray level. P1, lung air region; P2, P3, chest wall and soft tissue, and P4, vessel and heart.

(a) Typical CT slice image after DC component shifting. (b) Histogram of thoracic region excluding zero gray level. P1, lung air region; P2, P3, chest wall and soft tissue, and P4, vessel and heart.