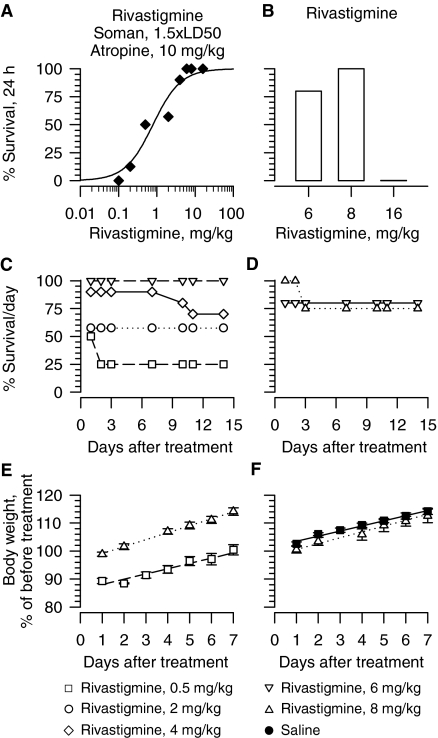
Fig. 4.
Effectiveness of rivastigmine in preventing toxicity of 1.5 × LD50 soman in atropine-treated guinea pigs. A, dose-response relationship for rivastigmine to afford 24-h survival of guinea pigs challenged with 1.5 × LD50 soman (42 μg/kg s.c) and post-treated with atropine (10 mg/kg i.m.). Animals were pretreated with rivastigmine (0.1–16 mg/kg i.m.), challenged with 1.5 × LD50 soman (subcutaneously) 30 min later and subsequently treated with atropine (10 mg/kg i.m.). Each group consisted of 8 to 12 animals. B, survival (24 h) of guinea pigs treated with rivastigmine alone. “% survival” represents the percentage of animals that were kept alive at 24 h after the treatment because they presented no life-threatening symptoms. C, D, long-term survival of guinea pigs that were pretreated with rivastigmine, challenged with 1.5 × LD50 soman and treated with 10 mg/kg atropine (C) or injected with rivastigmine alone (D). Each treatment group had 8 to 10 animals. E, F, body weight of animals subjected to different treatments. Results presented in E are from animals treated with rivastigmine (0.5 or 8 mg/kg i.m.) followed 30 min later by the subcutaneous challenge with 1.5 × LD50 soman and treatment with 10 mg/kg i.m. atropine. Results in F are from animals treated with 8 mg/kg i.m. rivastigmine alone or saline. As in Fig. 3, body weights are expressed as percentage of the weights measured 1 h before the first treatment. Data points and error bars represent mean and S.E.M., respectively, of results obtained from 18 animals in the saline group and from 5 to 8 animals in the other two experimental groups. Solid, dotted, and dashed lines are the linear regression of each data set; r2 ranged from 0.96 to 0.98.

