Figure 2.
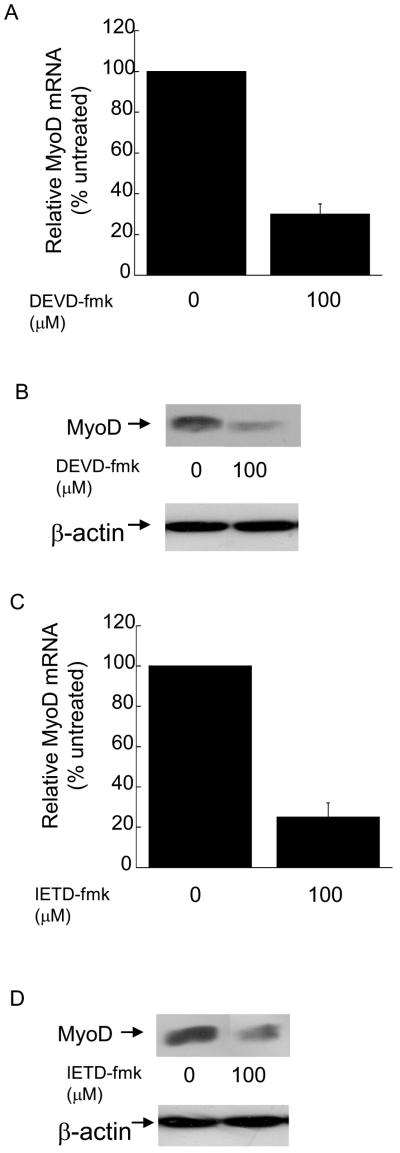
Skeletal myoblasts treated with either Z-DEVD-fmk or Z-IETD-fmk express decreased levels of MyoD mRNA and protein. Cells were plated at 4×10⁵ and the next day treated with the indicated inhibitor or solvent control for four hours. In (A and C), quantitative RT-PCR was used to assay for the relative levels of MyoD mRNA in total RNA samples. The Ct values for the MyoD PCR product were normalized to the Ct values for a b-actin product, run in parallel, as described in Materials and methods. Error bars represent mean +/- SEM from triplicates. Statistical analysis was performed as described in Materials and methods. Each value obtained after treatment with caspase inhibitor is significantly different from the corresponding value obtained after treatment with solvent (P < 0.03). In (B and D) whole cell protein lysates were prepared and equal amounts of protein were subjected to SDS-PAGE followed by Western analysis with anti-MyoD (Pharmigen) or anti-actin and visualized by autoradiogaphy as described in Materials and Methods. Shown are the results of one experiment that is representative of three independent experiments.

