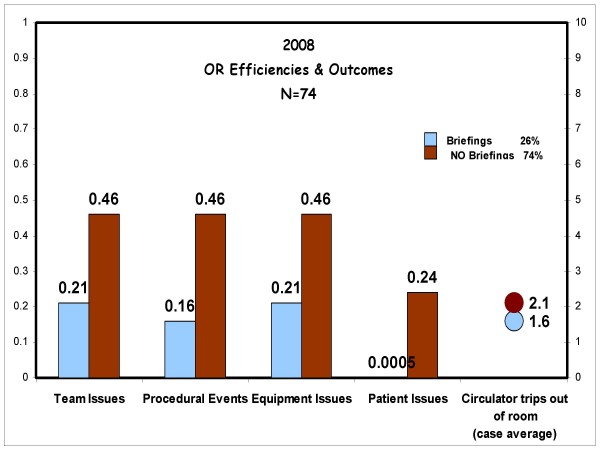
Figure 1.
Operating room efficiencies study. These are the results of our local operating room efficiency study. The x axis is the issues studied. The y axis is the frequency of the issues expressed as a factor of 1. The light color represents the efficiency of the operating rooms that performed a preoperative briefing and the dark color represents the operating room that did not have a preoperative briefing.

