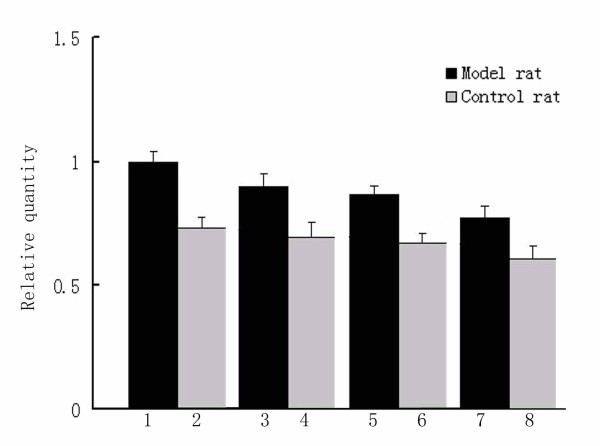
Figure 3.
Real-time PCR analysis of Gli3 expression in the hindlimb of ICTEV model rat and normal control rat embryos. Compared to the normal control, Gli3 mRNA expression was significantly enhanced. With birth drawing near, Gli3 expression in both model and normal rats had the tendency to decrease. Column 1, 3, 5 and 7 show Gli3 relative expression in ICTEV model rat at GD15, GD17, GD19 and GD21, respectively. Column 2, 4, 6 and 8 show Gli3 relative expression in normal control rat embryos at GD15, GD17, GD19 and GD21, respectively.

