Figure 6.
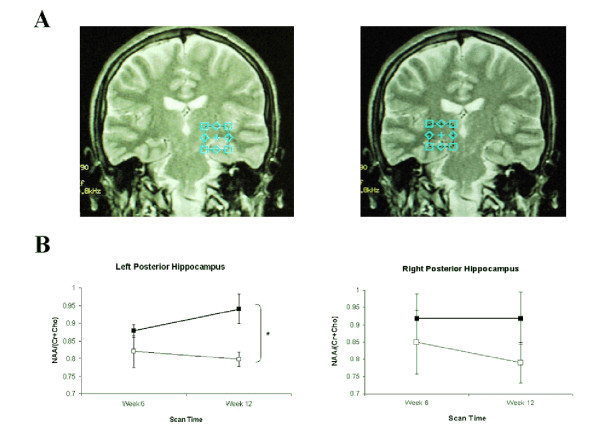
MR Spectroscopy voxel location, metabolic measures across batteries and schematic representing correlations between behavioural performance and metabolism. A) Localisation of the left and right posterior hippocampal voxels (2 cm × 2 cm × 2 cm) used in MRS scanning. B) MRS metabolism as measured by ratio of NAA/(tCr+Cho) at the left and right posterior hippocampal voxels. At Week 12/Scan 2, Group A (heavy line, filled squares) had a significantly larger ratio than Group B (thin line, empty squares) for the left posterior hippocampus; no significant change was observed at the right posterior hippocampal voxel.

