Figure 1.
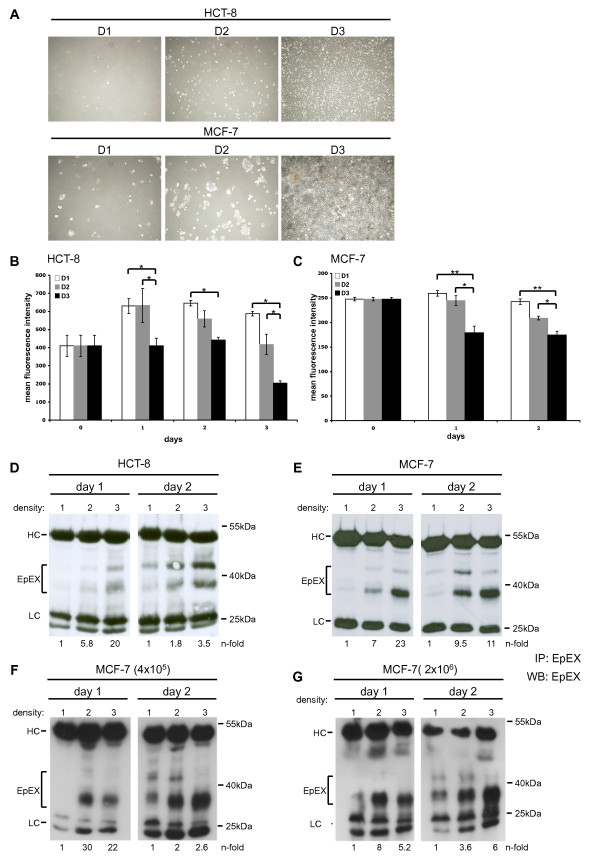
EpCAM cleavage is dependent on cell-to-cell contact. (A) HCT8 and MCF7 cells were seeded at three different confluencies (D1-3), which resulted in single cells (D1), 20% (D2), and 80% confluency (D3). (B, C) Cell surface expression of EpEX was assessed in samples of D1-D3 conditions over a time period of 2-3 days. Shown are the mean fluorescence intensity ratios of EpEX/control with standard deviations from three independent experiments for HCT8 (B) and MCF7 cells (C). Significant differences are marked (* p < 0.05; ** p < 0.005). (D, E) Soluble EpEX was assessed in supernatants of HCT8 (D) and MCF7 (E) cells in samples of D1-3 conditions. Equal amounts of protein from cell-free supernatants were immunoprecipitated (IP) with EpEX-specific antibodies and EpEX detected by immunoblotting with specific antibodies in combination with HRP-conjugated secondary antibody (marked EpEX). (F) MCF7 cells were plated at 4 × 10⁵ (left panels) or 2 × 10⁶ (right panels) on increasing areas corresponding to D1, 2, and 3. At day 1 and 2, cell-free supernatants were processed as in E. Levels of EpEX were assessed by image densitometry, normalised for the amount of heavy chain, and values for D1 set to one for a reference. EpEX levels are given n-fold of D1. Shown are representative results from three independent experiments. HC: heavy chains of IP antibodies. LC: light chains of IP antibodies.

