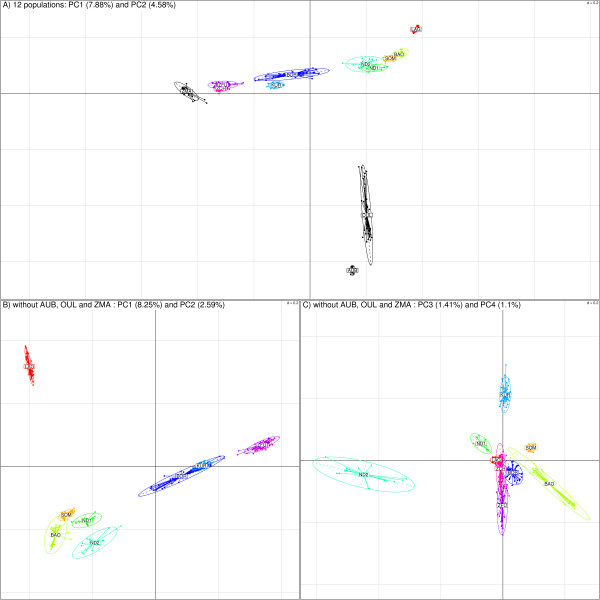
Figure 2.
PCA results. Plots of the individuals according to their coordinates on the first two principal components on the eigenanalysis with (A) and without (B) the three outgroup populations (AUB, OUL and ZMA). Plots on the third and fourth components for this latter analysis are shown on Figure 2C. Ellipses characterize the dispersion of each breed around its center of gravity (assuming the cloud is a random sample distributed according to a bivariate gaussian distribution, the probability for an individual to be within the ellipse is 0.9).

