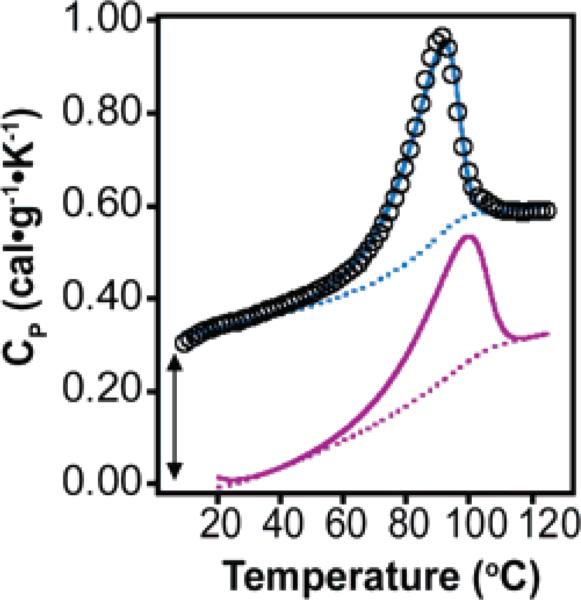
Figure 5.

DSC analysis of 300 μM Acid-1Y fit to a subunit dissociation model as described in Supporting Information. Raw data are shown as black circles, the calculated thermogram is shown as a blue line, and the baseline as a dotted blue line. The calculated thermogram and baseline for 300 μM Zwit-1F are shown as purple solid and dotted lines, respectively. The Acid-1Y data set is offset artificially for clarity, as indicated by the arrow.
