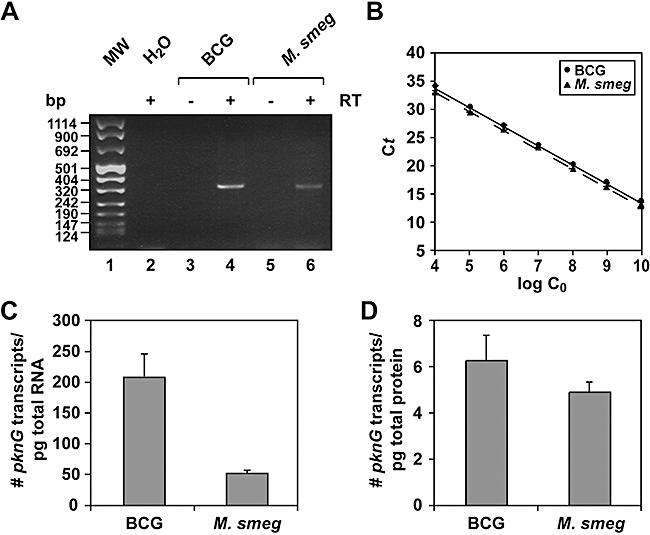
Fig. 7.

Analysis of pknG transcription in M. smegmatis. A. cDNA was prepared from total M. bovis BCG and M. smegmatis RNA by using reverse transcriptase and random primers. cDNA of pknG was amplified using gene-specific primers. As a control the same reactions were carried out without reverse transcriptase (−RT) or without RNA (H2O). B. Standard curves for M. bovis BCG and M. smegmatis pknG TaqMan primer/probe sets were constructed from serial dilutions of known quantities of in vitro synthesized transcripts. Threshold cycle (Ct) values were plotted against copies of transcripts. C and D. PknG mRNA expression in M. bovis BCG and M. smegmatis per pg of total RNA (C) and per pg of total protein (D). Copies pg−1 total RNA were calculated from the standard curves shown in (B). These values were subsequently corrected by the RNA : protein ratio (see Experimental procedures) to calculate the number of PknG mRNA copies pg−1 total protein. Results are mean values (±SD) from three RNA isolations. M. smegmatis PknG mRNA levels were not significantly different from M. bovis BCG PknG mRNA levels (P > 0.05).
