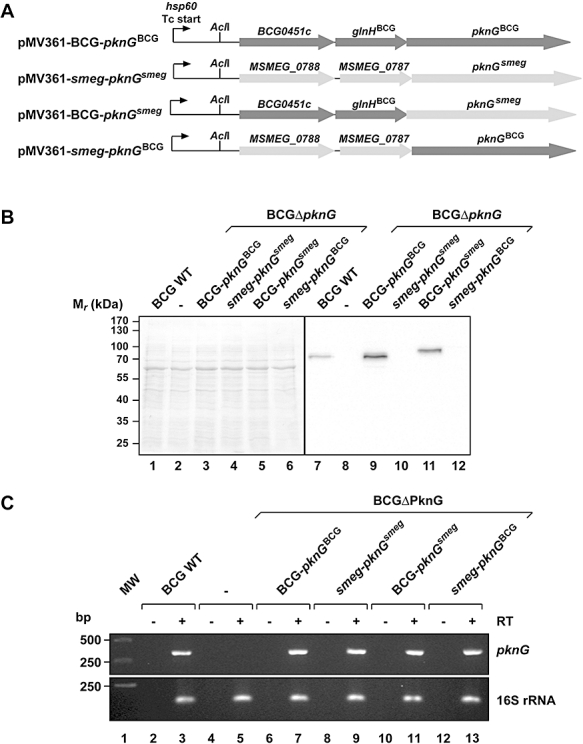
Fig. 8.

Analysis of the influence of the upstream region of M. smegmatis and M. bovis BCG pknG on pknG expression. A. Schematic representation of the fusion constructs used in this experiment. All constructs were introduced in the pMV361 vector at the AclI restriction site in the hsp60 promoter leaving the transcription (Tc) start intact (see also Experimental Procedures). pMV361-BCG-PknGBCG, pMV361 with M. bovis BCG pknG and its own upstream region; pMV361-smeg-PknGsmeg, pMV361 with M. smegmatis pknG and its own upstream region; pMV361-BCG-PknGsmeg, pMV361 with pknGsmeg fused to the M. bovis BCG pknG upstream region; pMV361-smeg-PknGBCG, pMV361 with pknGBCG fused to the M. smegmatis pknG upstream region. B. Lysates from M. bovis BCG (lane 7) and M. bovis BCGDΔpknG transformed with empty vector (lane 8) or the plasmids shown under (A) (lanes 9–12) were separated on a 10% SDS-PAGE gel and immunoblotted using anti-PknGBCG antiserum (right). The total protein pattern was analysed by Ponceau Red staining (left). C. cDNA was prepared from total RNA isolated from M. bovis BCG wt and the M. bovis BCGΔpknG transformants analysed under (B) by using reverse transcriptase and random primers. cDNA of pknG was subsequently amplified using gene-specific primers. As controls the same reactions were carried out without reverse transcriptase (−RT) or in stead of pknG primers with 16S rRNA-specific primers. Representative data from three experiments are shown.
