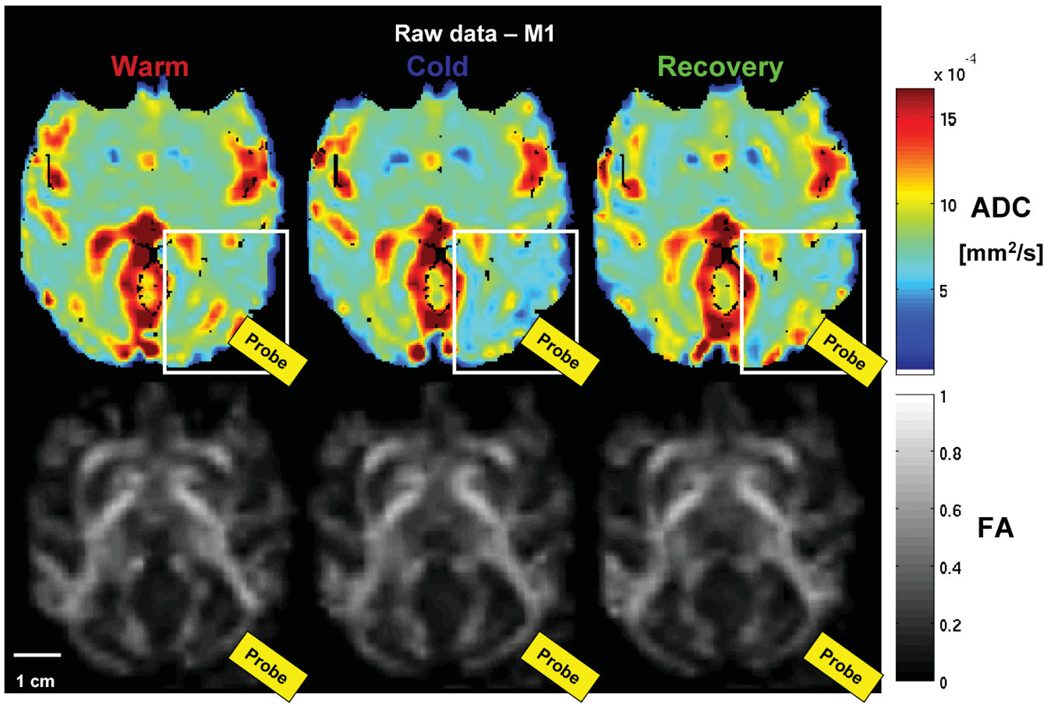
FIG. 3.
Epoch-averaged ADC (top row) and FA maps (bottom row) for the warm, cold, and recovery conditions for an experiment where the temperature under the probe = 8°C (cortical deactivation #1, M1). The change in ADC is apparent under the probe (white rectangle) during the cold condition, however, no change in the FA is visible.

